Release Date: 21st June 2019
- My Tasks
- Named Person Changes
- Analysis Permission
- Multi-Query / Multi-Axis Graphs
- CSR – Expose Calculation to Custom Fields
- EPR Import – Aggregating Total Usage/Cost for Non-Meter-Reading Factors
- EPR – Sign Off Stage
My Tasks
To give you greater oversight over your AVA activities we’ve now activated the My Tasks link, a dedicated area to see what’s assigned to you, for you to action.
You can find the My Tasks link at the top of the AVA Home Screen or at the top of the top of the Module Quick Access pane.
In the My Tasks pane you will see records across all AVA modules that are waiting for you to complete, triage or sign off.
Your Tasks will be ordered by that Module’s Key Date, from oldest (or most overdue) to newest.
We’ve also included a Recent Activity pane to show records you’ve accessed recently, in descending order of when you last viewed them. You will see a green notification dot if that record has been updated since you last looked at it.
If you’d like, you can add My Tasks as your landing page (the first page you see when you log in to AVA). You can find this setting by selecting your User icon at the top right of the toolbar.
Named Person Changes
To give some of our clients even more flexibility regarding record access, we have amended our permission checks to allow users that have been named within a record to access that record even if they don’t have Read permissions for the reporting point the record has been assigned to.
New Analysis Permission
To account for the Named Person Changes we have created a new Analysis Permission to give you greater control over who can access what across AVA.
- Analysis allows you to see records in search results, charts and tiles at your assigned reporting points
- Read allows you to see the record details and export records at your assigned reporting points
This means if you have been granted Analysis permissions, but not Read, you can query records at your reporting points but you won’t be able to see their record details unless you have been specifically assigned to those records.
Analysis has been automatically assigned to our current Users with Read permissions, so when this functionality is released your current workflow will be unaffected unless your System Administrator makes any changes for you.
Multi-Query / Multi-Axis Charts
To allow the option to overlay multiple charts over each other we’ve made some big changes to how our Chart Tiles are edited and stored.
Here’s a summary of how our Chart Tiles work:
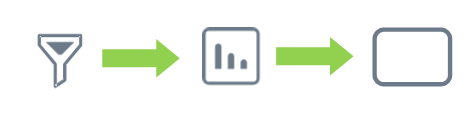
- The records returned from your Query results make up the data that fills a Chart within a Dashboard Tile
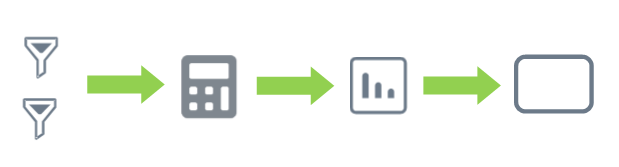
2. Multiple Queries feed into a Rate Calculation to create a Rate Chart on a singular Dashboard Tile
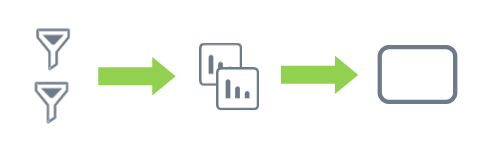
3. Now, multiple Queries can be used to overlay different Charts on a singular Dashboard Tile
Before:
After:
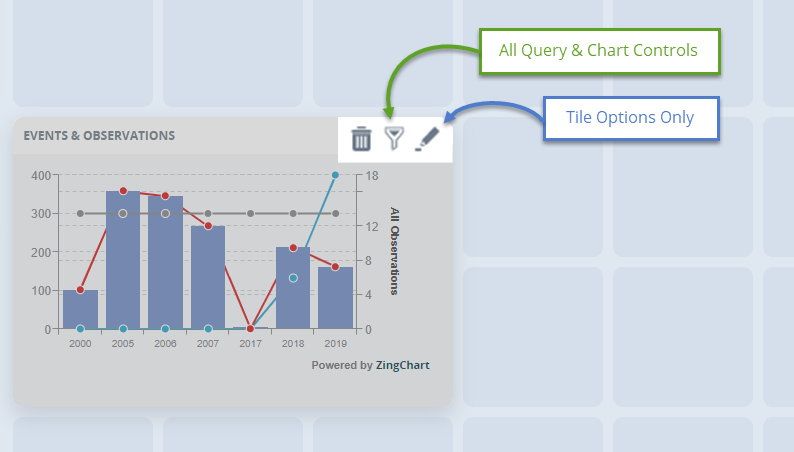
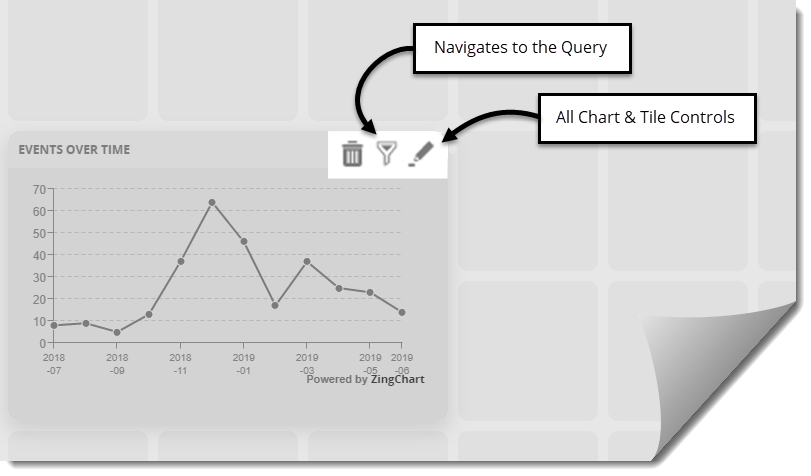
Query & Chart Controls
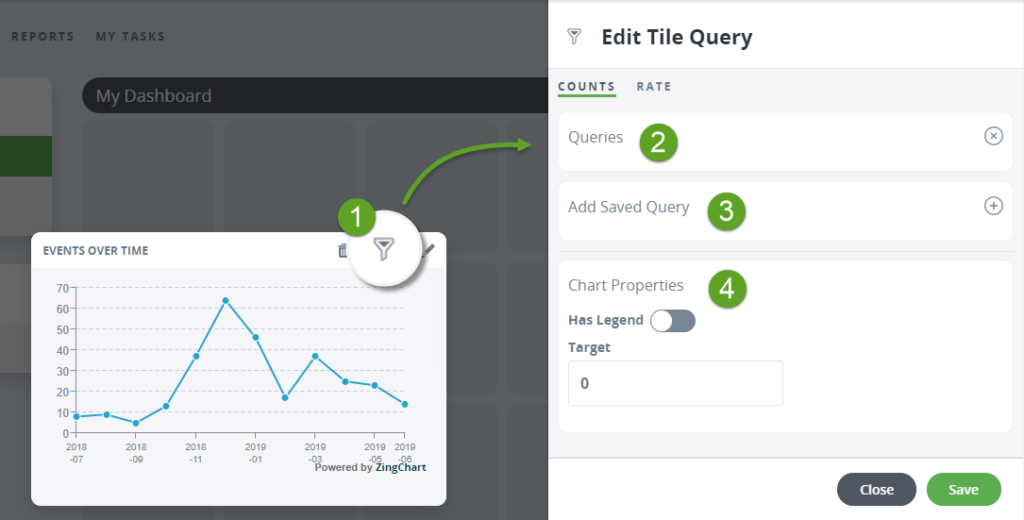
- In Tile Edit Mode, select the Filter icon to get the Edit Tile Query Pane
- Queries – Within this segment you will see existing Queries underpinning your Chart Tile (see below)
- Add Saved Query – To add more Queries (which in turn will display as a new Chart) you must have them saved already (Run a Query for your chosen Module and Save)
- Chart Properties – Here you will find properties that affect the whole Chart within your Chart Tile
Queries
With the Queries segment expanded you will see the below options:
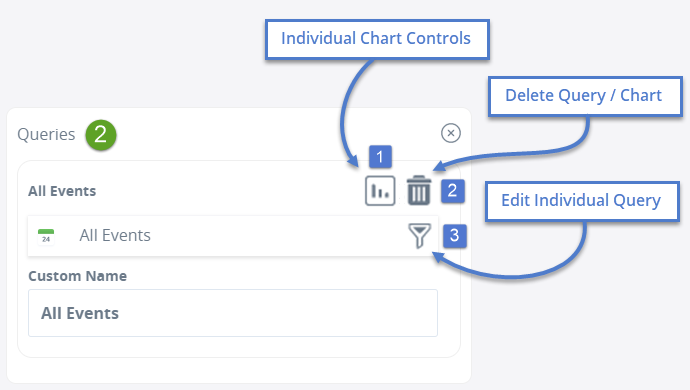
- Individual Chart Controls – All the standard chart controls to edit
- Delete Query / Chart – Removes it from your Chart Tile
- Edit Individual Query – This takes you to the Search screen for the individual Saved Query so you can edit the filters applied
Chart Properties
Properties that affect the whole Chart within your Chart Tile. Note that selecting a Group By field that is not present in one of your Module Queries may show as a blank entry along your X-Axis.
Multi-Axis Charts
Checking the Additional Y-Axis Chart option for any additional Queries will give that Query it’s own Y-Axis on the right-hand side of your Chart.
Some things to Note:
- Selecting a Group By field that is not present in one of your Module Queries may show as a blank entry along your X-Axis
- Any colours for a Series that were randomly assigned may change once we migrate to the new version of Chart Tiles. Colours for Series can still be assigned as they were before
- Currently, Rates can only be added via the Tile Catalogue. This means you can add a Count-based Chart to an existing Rate Chart Tile but you cannot add a Rate to an already existing Count-based Chart Tile
- For Reports, Multi-Query features will only be present for newly added Chart Tiles