Release Date: 9th June 2020
Previously, when using our Rate Charts you were limited to AVA’s Out-the-Box Rates, with little indication of what calculation was being performed behind the scenes.
With this latest release, our Rate calculations are now exposed so you can see what’s being calculated as well as edit some of the elements of the calculation.
How to make use of this feature
- Switch your Dashboard to Edit mode
- Open the Tile Catalogue
- Add an Out-the-Box Chart Tile (Look for a Graph Tile such as an Accident Frequency Rate)
- Edit your Chart Tile by selecting the Query icon
- Look for the new Edit Rate Formula option
What you can do with the new options
By selecting certain Rate Charts you are given different editable options.
Most Rate Charts, including Accident Frequency Rate, will give you:
- A / B * C
Otherwise, Accident Incident Rate will give you:
- A / ( B / D ) * C
The D operand is used to average the values over a 12 month period.
You can edit the Operands (A, B, C, D) …
… but not the overall formula Operators ( /, * )
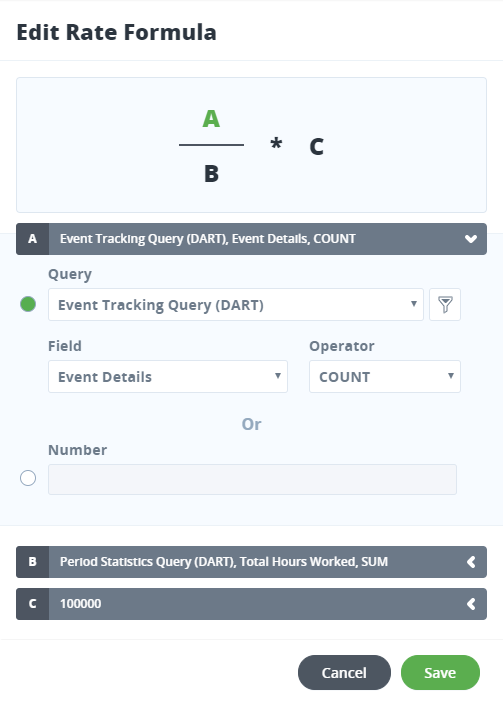
For each Operand you can choose:
- the Original Query produced by the Out-the-Box Rate Chart from the Tile Catalogue, driving a Count of records (Choose System ID) or a Number Field across records
- a Saved Query driving a Count of records (Choose System ID) or a Number Field across records
- a flat Number
Please be aware, if you edit your Saved Query from this screen, you will be directly editing your Saved Query, not a copied version of it.