Release Date: 5th February 2020
Charting by KSB Category
Do you want to report on the number of Safe/At Risk observations? We now have the ability to chart by KSB Category using Pro-Active Module record data.
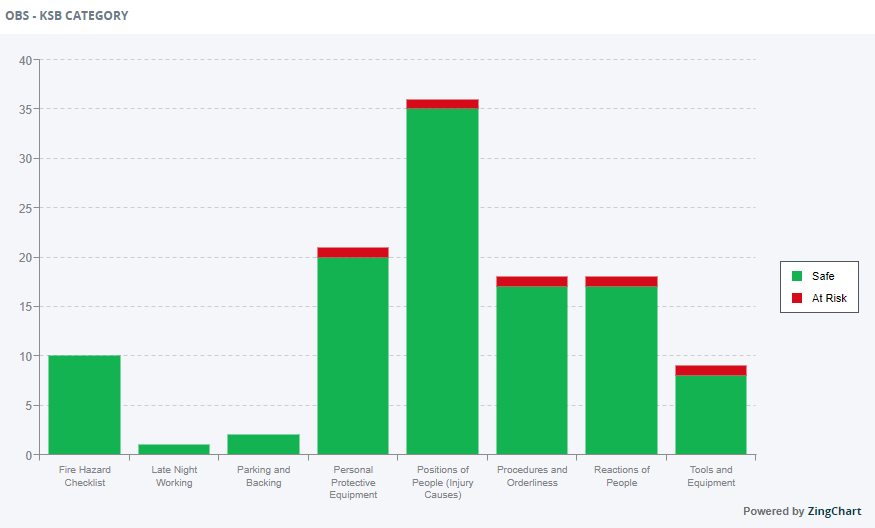
To replicate this Chart Tile on a Dashboard you will need to:
- Run a new or previously saved Pro-Active Query
- Select the ‘Create New’ button, Graph Tile
- Pin to your chosen Dashboard
- Edit your Chart Tile
- Under Chart Properties > Group By: choose ‘KSB Category’
- Edit Chart Options
- Aggregate Field: Observation Response
- Operator: count
- Series: Observation Response
- Choose ‘Is Stacked’ to recreate the above Chart
OSHA Updates
With the recent release of the OSHA functionality in AVA, we’ve now added the new core fields to the UDQ filter options. This will help with the creation of the queries for the various OSHA reports that need to be produced.
My Tasks
Any closed items are now filtered out of the My Tasks view to make it easier to find the records that need your attention.
Legally Privileged Email Notifications
There has been a change to how email notifications are sent surrounding event records that are set to be legally privileged.
When you set the record to be legally privileged and you get prompted for the list of legally privileged users, only those named users will get email notifications if they have legally privileged permissions.
For subscription emails, those named users, as long as they have at least the analysis permission, will receive the emails.
Bug Fixes
- Audit Bugs around naming validation
- Text wrapping with ZingCharts
- Performance improvements for attached images