Available Now
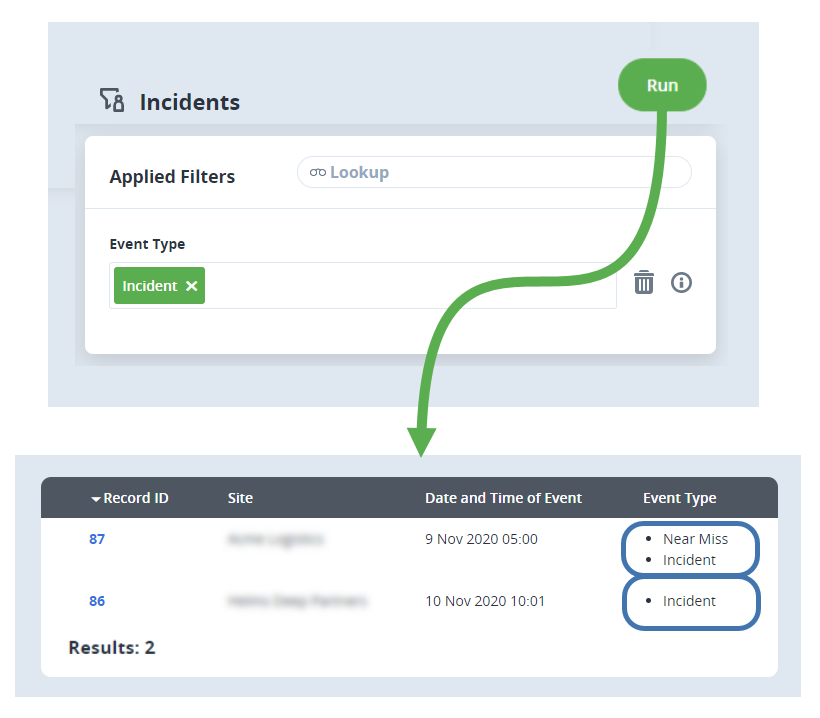
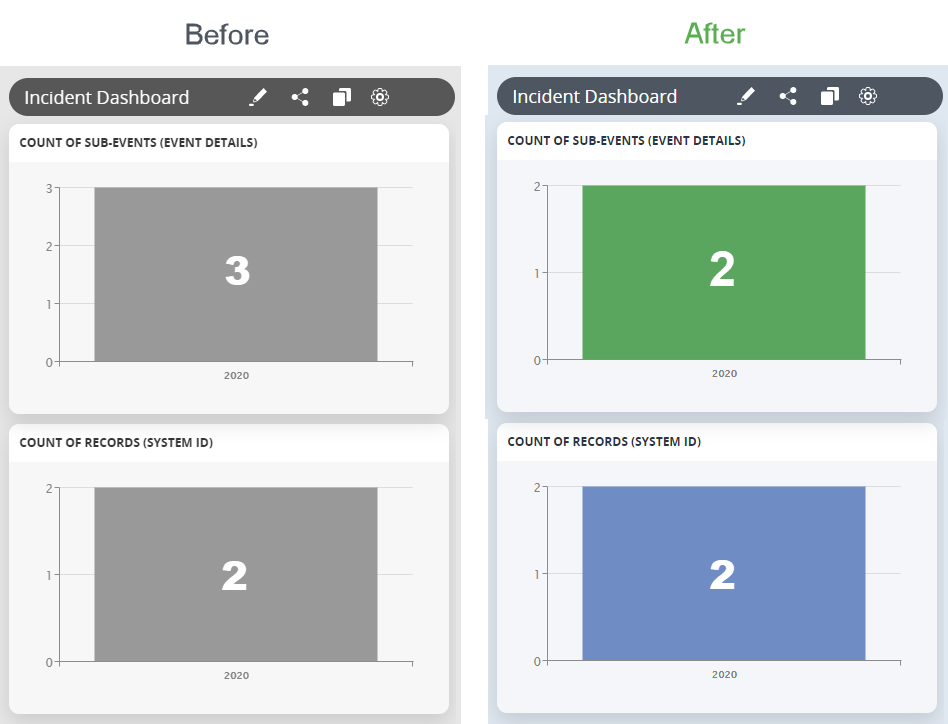
For our modules that contain multiple-entries within the one record, such as Incident Management (Events), Environmental and Risk Assessment, when creating a Chart Tile, totals were based on the total number of multiple entries within a record, rather than just the ones that were included in the filters.
Going forward, Charts will now apply the filters at each multi-entry level, as per the example below:


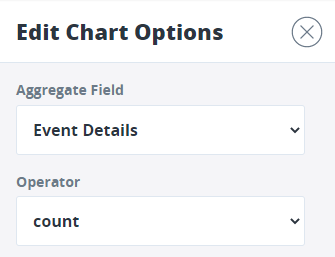
If you’re not sure what’s being counted in your Chart, check the Aggregate Field within Chart Options.
- Event Details – The Number of Multi-Entries
- System ID – The Number of Distinct Record IDs

