We are rolling out some changes to One Search (the search within the EHS toolbar)
Find out moreCategory: Categories
Modules / Areas within AVA

Audit: Responses now have associated colours
Your Audit Templates that use the “Green, Amber, Red” response lists will start to see some colour!
Find out more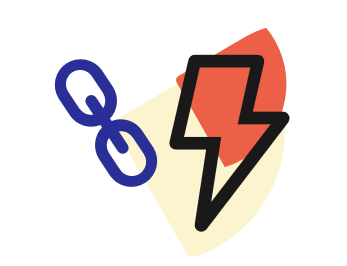
Ability to link multiple actions across modules
This feature will allow you to create and link multiple actions at the detail level, available across different modules in the system.
Find out more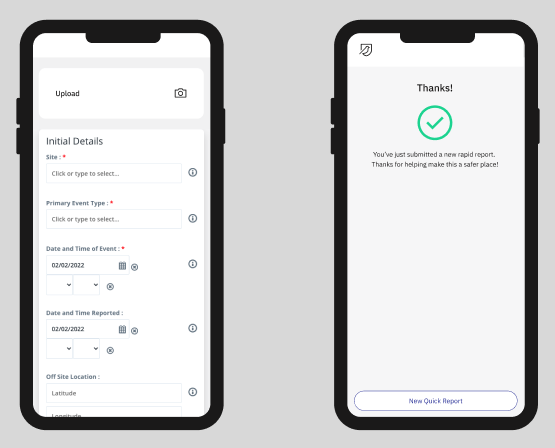
NEW! Quick Report
A new frictionless way to capture Incidents
Find out moreAudit: Analyse by Tab, Section & Questions
There are some new Audit options for charts in your Dashboards. You are now able to see a break-down of answers and findings by Audit Tab, Section and even Question-level, giving you greater insight into your company audits.
Find out moreCharts: Update to values shown on Axis
We have made some changes to how axis values are calculated and then displayed within charts
Find out more
Using EHS on Mobile & Tablets
If you happen to use EHS from your browser on a mobile or tablet, you may have noticed some changes! This is a glimpse of what is to come as we move from our current native app (the app you download from the app store) to our progressive and responsive web app.
Find out more
Alerting you to Record Conflicts
We have moved from a “Last-Save-Wins” to a “First-Save-Wins” approach to saving records
Find out moreNew Sliding Date Options
We have added some new options so that you can have a consistent view of data over time.
Find out moreDashboards: Restrict the Number of Decimal Places shown on Charts
We have added a new ability to restrict the number of decimal places shown on Count and Rate Charts
Find out more